TCR/BCR
Repertoire
Analysis
- TOP
- To Researchers
- Our Technologies
- TCR/BCR Repertoire Analysis
TCR/BCR Repertoire Analysis
Unbiased Next-gen T Cell Receptor (TCR)/ B Cell Receptor (BCR) Repertoire Analysis
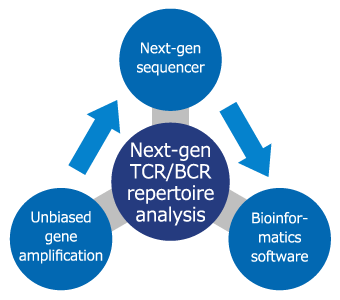
Repertoire Genesis Inc. has developed a Next-Gen T cell receptor (TCR) / B cell receptor (BCR) repertoire analysis that uses unbiased gene amplification technology and dedicated bioinformatics software (Repertoire Genesis) developed by us.
This technology is quantitatively superior to conventional technology and can be used for a wide variety of applications, e.g., detection of malignant lymphoma and leukemia, identification of antigen-specific TCR/BCR, and evaluation of efficacy of immune checkpoint blockers and cancer immune therapy.
Repertoire Genesis Inc. will support the development of new diagnostic and therapeutic methods through the collaboration using cutting-edge technologies.
What is a Repertoire ?
White blood cells composed of granulocytes, dendritic cells, macrophages, and lymphocytes, play an essential role in body defense by eliminating invading pathogens such as viruses and malignant cells.
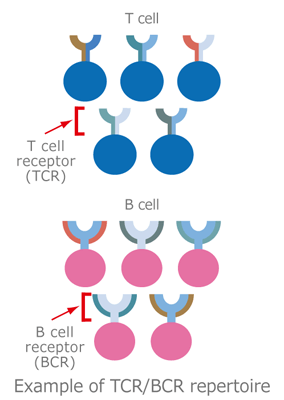
The main types of lymphocytes, T cells and B cells, surface-express receptors that recognize antigens, T cell receptor (TCR) and B cell receptor (BCR), respectively. They are activated to initiate an immune reaction in response to specific binding of their receptors to antigens such as tumors and viruses.
A huge variety of TCRs and BCRs are created by the mechanism of gene rearrangement and somatic hypermutation to react to various antigens. The variety is estimated to reach 1018 for TCR and 1014 for BCR.
This collection of T/B lymphocytes characterized by TCR/BCR bearing different antigen specificities is known as the “TCR/BCR repertoire.” “Repertoire” is a French word describing a stock of skills or performances.
Utility of Repertoire Analysis
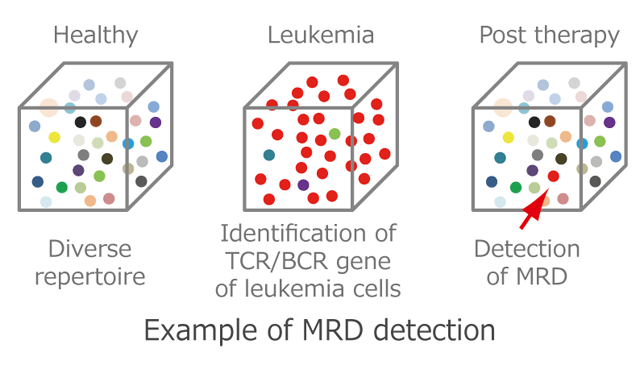
TCR/BCR repertoire analysis is useful for determining immunological status and abnormality. Because a single T cell or B cell proliferates abnormally in patients with certain kinds of leukemia and malignant lymphoma, detection of the malignant cells is used for diagnosing and estimating treatment effects. But conventional methods such as flow cytometric analysis or immune histochemical staining are limited in sensitivity and accuracy.
Nucleotide sequences of TCR/BCR reads ranging from 10^5 to 10^7 can be determined by next-gen TCR/BCR repertoire analysis. In this manner, malignant cells present at a frequency of less than one in one hundred thousand (less than 0.001%) can be identified at a clonal level; and thus, be useful for detection of minimal residual disease (MRD).
TCR/BCR repertoire analysis is useful for evaluating the diversity of an immune system. Although immune diversity is essential to host defense against infections by viruses and bacteria, it is not feasible to quantitatively evaluate immune diversity. The extent of immune diversity and its alterations may be used for developing a prognosis after transplantation.
It is possible to obtain antigen-specific TCR/BCR genes by determining nucleotide sequences of large number of TCR/BCR genes at the clonal level. This technology is very useful for obtaining antigen-specific TCR/BCR genes by analyzing samples from antigen stimulation, virus infection, and disease patients.
Major Technologies

Unbiased Gene Amplification Technologies (Adaptor-ligation PCR)
An adaptor is added to the 5′ terminus of dsDNA of TCR. PCR is performed with the adaptor primer and a gene-specific primer specific for the 3′ constant region. In contrast to conventional multiplex PCR, which is subject to bias due to differences in amplification efficiency among multiple primers, this technology achieves high-accuracy repertoire analysis without bias.

Next-gen Sequencer (MiSeq)
Nucleotide sequences of TCR/BCR genes are determined with long reads by next-gen sequencers that produce 105~107 reads in a single run.
Dedicated Software for Repertoire Analysis (Repertoire Genesis)
Determination of variable, diverse, and joining regions with homology search, amino acid translation, and sum of read counts is performed. A dedicated software package for high speed, high accuracy, and automated processing has been developed.
"Pair Identification" of Repertoire Using Single Cell Analysis
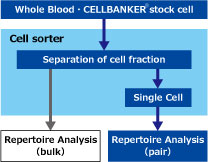
In order to obtain reliable "pair" information, it is necessary to monoclonate the cells and perform repertoire analysis.
Different from general single cell analysis, single cell analysis of repertoire analysis is supposed to analyze a small number of cell populations with limited functions.
We propose efficient "Pair Identification" in specific fractions using cell sorter, using whole blood specimens and cells preserved in CELLBANKER®.
Applications for Repertoire Analysis
Lymphoma and Leukemia

Determination and tracking of TCR/BCR genes at the clonal level Detection of minimum residual disease
Infectious Disease
- Determination of virus-specific TCR Identification of genes
- of virus antigen-specific antibodies
Immune Checkpoint Blockers
Determination of virus-specific TCR Identification of genes of virus antigen-specific antibodies
Support of TCR Gene Therapy Development
Identification of tumor-specific TCR and application to treatment
Bone Marrow Transplantation
Evaluation of immune recovery by repertoire analysis
Support of Chimeric Antigen Receptor T
Chimeric Antigen Receptor T-cell (CAR-T) development Acquisition of BCR genes for preparing useful CAR-T
Cancer Vaccines, Immune Cell Therapy
- Efficacy evaluation of cancer vaccines, immune cell therapy
- Detection of tumor-specific TCR
Support of Antibody Drug Development
Efficient screening of complete human antibody genes
Technical Details
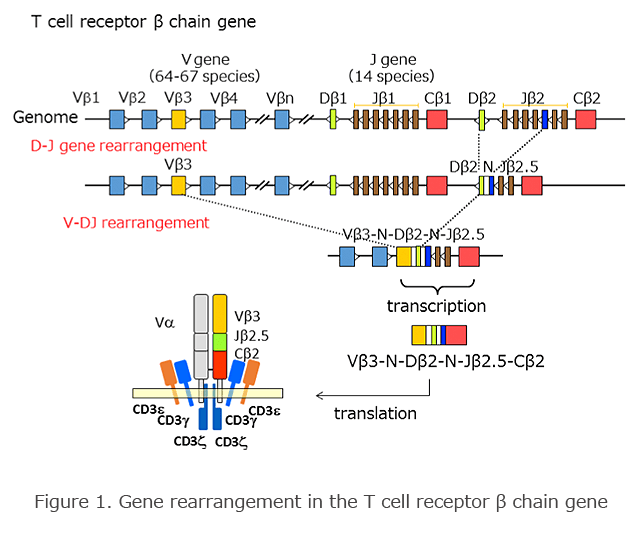
T Cell Receptor (TCR) Gene Structure
The TCR gene, as well as the immunoglobulin gene, consists of a number of gene fragments on the genome such as V (variable), D (diversity), J (joining), and C (constant) gene regions (Figure 1). Gene rearrangement occurs during the differentiation and maturation of T cells. In the β chain gene, one of each of the D and J genes bond randomly. Subsequently, gene rearrangement occurs between the V and DJ genes. In this process, insertion and/or deletion of nucleotides (N region) randomly occur between the V and D and D and J regions, and this increases the diversity of the gene. In the precursor messenger RNA, splicing occurs in the VDJ region and C (constant) region, and it expresses as a functional TCR gene.
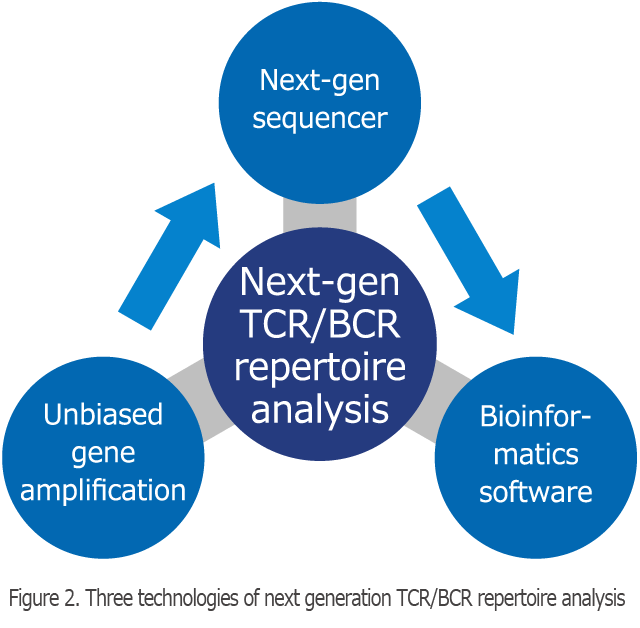
Three Technologies of The Next Generation TCR/BCR Repertoire Analysis
The next-generation TCR repertoire analysis method of Repertoire Genesis, Inc. consists of three technologies, namely long-read gene sequence, unbiased gene amplification technology, and dedicated bioinformatics software (Figure 2). In the TCR repertoire analysis, to assign the V, D, J and C regions, a long-read sequence (400–600 bp) is required. Next-generation sequencing (NGS) is possible for a large amount of sequencing, but the drawback is that length of determined nucleotide sequence is short. For this reason, we have utilized relatively long-read sequencers such as 454 sequencing (Roche) and MiSeq (Illumina). We also need to equally amplify all of the TCR genes, which are composed of a number of gene fragments. At Repertoire Genesis, Inc., we use the adaptor-ligation PCR method, which adds an adapter sequence at the 5′-end of the DNA, which is then subjected to PCR amplification using a pair of primer sets consisting of an adapter primer and a C region-specific primer. Thereby, we can amplify all TCR or BCR genes without bias.
At the same time, we have developed our original, dedicated, fully automatic repertoire analysis program called Repertoire Genesis to process the data output from the NGS at high speed and accuracy. We were able develop a next-generation TCR/BCR repertoire analysis that integrated unbiased gene amplification technology and original bioinformatics software.
Unbiased Gene Amplification
In the TCR/BCR repertoire analysis, the sequence of CDR3, which has the most important information, must be determined. When the genomic DNA is amplified, because it is not possible to develop a primer for the C region, multiplex PCR, which uses many primers targeting the V region of the 5′-end and the J region of the 3′-end, is often utilized. In this case, PCR bias occurs due to the difference in amplification efficiency between the primers, and mismatches between the designed primers and templates are inevitable; thus, PCR amplification failure occurs in some parts of the gene. If you have used RNA as material, you can use a C region-specific primer, but you still need a large number of V-specific primers. Therefore, we have adopted the adaptor-ligation PCR method, which adds an adapter sequence at the 5′-end of double-stranded DNA, which is then subjected to PCR amplification using a pair of primer sets consisting of an adapter primer and a C region-specific primer (Figure 3). Thereby, all TCR or BCR genes can be amplified without bias.

Complementary DNA (cDNA) is synthesized from total RNA via a reverse transcription reaction using the poly (T) primers. Subsequently, cDNA is used as a template to synthesize double-stranded DNA (dsDNA) using some enzymes. A double-stranded adapter, which also serves as a PCR primer at the 5′-end of the dsDNA, is added via a ligation reaction. PCR amplification using a pair of primer sets consisting of an adapter primer and a constant region (C region)-specific primer is then performed.
Bioinformatics
For the vast gene data obtained via NGS, it is necessary to perform homology analysis of individual sequence read to the reference sequence and assign the V, D, J, and C sequences. In the public database, High-VQUEST (the international ImMunoGeneTics information system®: IMGT, France) and IgBLAST (National Center for Biotechnology Information: NCBI, USA) have been provided. We have developed a dedicated repertoire analysis software (Repertoire Genesis). This software can perform activities such as matching the obtained V, D, J, and C sequence data to reference sequences, amino acid sequence conversion, extraction of the CDR3 sequence, and read aggregation at a high speed. In addition, a variety of outputs of aggregate results and graphs are possible, and the usability of the software is high. Because it operates on a dedicated server, it also has improved security and speed of analysis.
Analysis Results Example
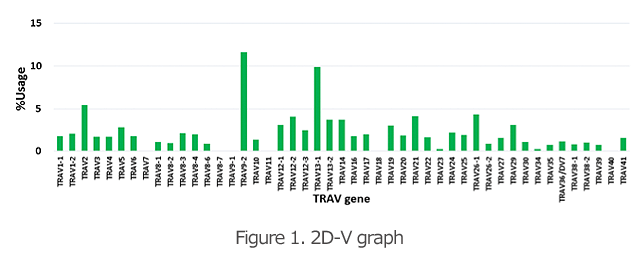
2D and 3D graphs
High-resolution analysis is now available using next-generation TCR/BCR repertoire analysis, which utilizes large sequence data.
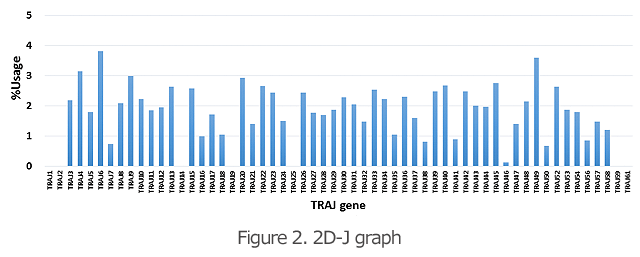
The 2D graphs (Figures 1 and 2) show what percentages of the V and J genes are being used for the TCR and BCR in the specimen. Comparison of the frequency of gene usage among samples and identification of the outliers are possible.
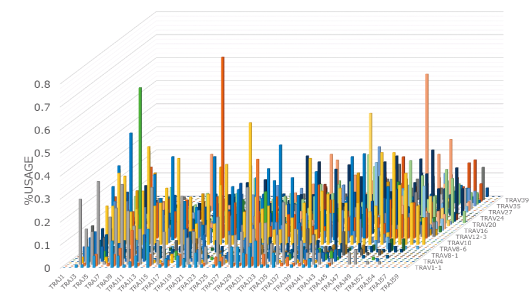
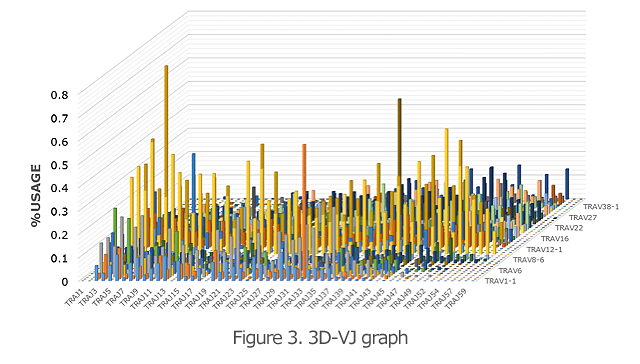
The 3D graph of the VJ gene shows the frequency (%) of usage of the combination of each VJ gene in the TCR and BCR (Figure 3). Hence, you can see a bird’s eye view of the entire repertoire. From the increase in specific VJ gene usage, it is also possible to detect changes in clonality.
Ranking Table
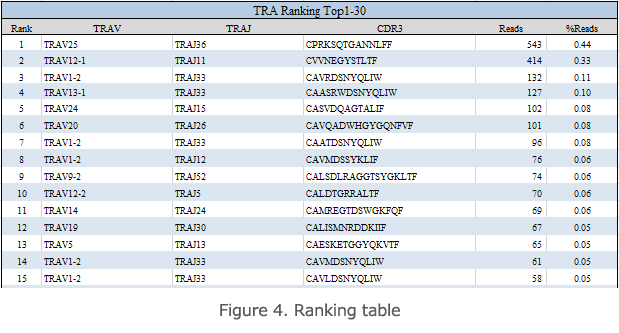
The aggregate ranking table shows a rank table ordered by the copy number of unique reads of TCRs or BCRs present in the specimen (Figure 4). V, J, the CDR3 sequence, frame, the number of reads, and the frequency (%) of each TCR read are shown in this table. In the case of specimens with high clonality, a small number of high-copy reads are detected.
Secondary Data Analysis
We offer secondary data analysis, which includes statistical analysis and graphing based on TCR/BCR repertoire primary analysis data, as an optional service. Examples are shown below.
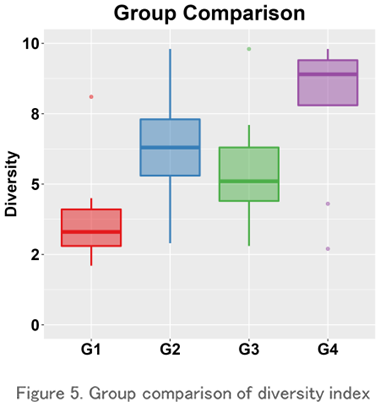
Group Comparison
This is a boxplot of the Repertoire diversity index for each group (the group you want to compare). It is one of the most commonly used evaluation methods for comparison using the diversity index because it is easy to understand the range of data, the median value, and the presence or absence of outliers.
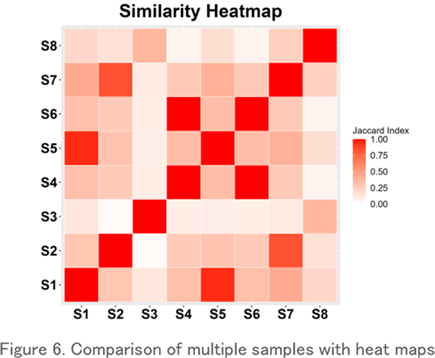
Comparison with Heatmaps
TThis is a heatmap visualization of the Jaccard index, which shows the repertoire similarity between samples. It clearly shows which samples have the most similar repertoires.
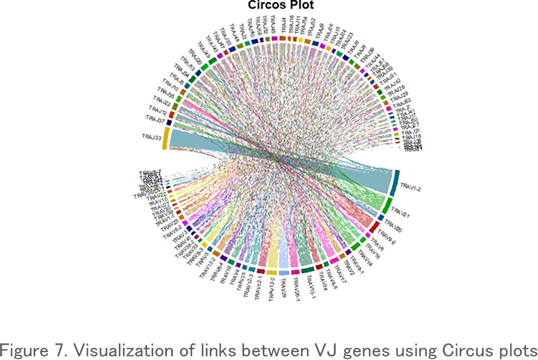
Circos Plot
Circos plots, which display repertoire data in a circular layout, are often used to visualize VJ gene associations. Each link indicates a particular VJ gene combination and its frequency of occurrence, and thicker links indicate a high frequency of existence.
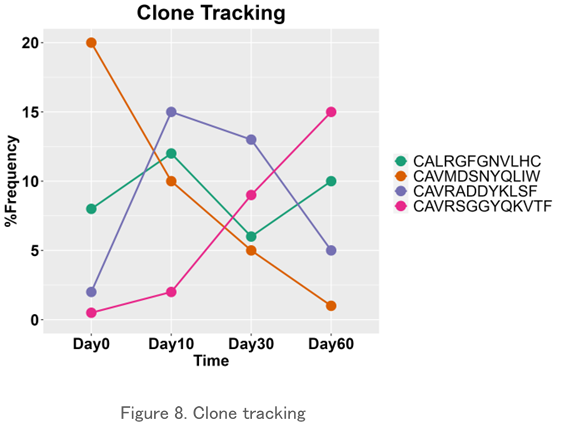
Clone Tracking
The frequency of existence of a particular clone over time is plotted. It may be possible to examine the variability of individual clones identified in the CDR3 sequence and detect the response of the repertoire to external stimuli.
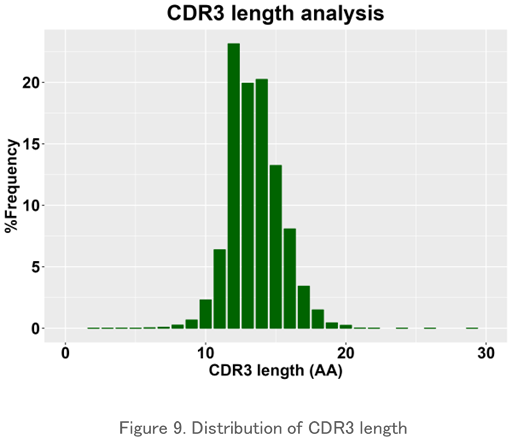
CDR3 Length Analysis
The length distribution of the amino acid sequence in the CDR3 region is plotted. It usually has a normal distribution-like pattern, and peak changes can be seen when a particular clone increases. It is used to evaluate the characteristics of the repertoire for each sample.
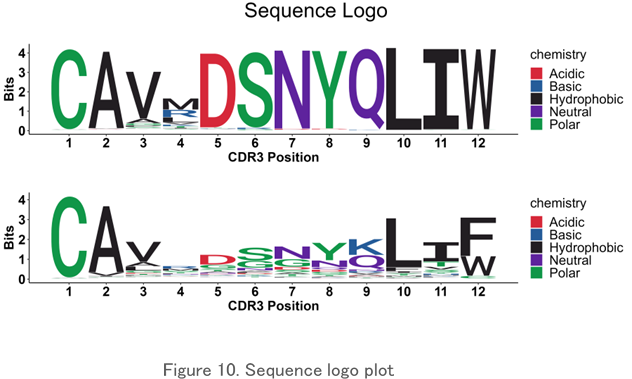
Sequence Logo Plot
The pattern of the amino acid sequence in the CDR3 region is displayed visually in an easy-to-understand manner. It is used to find common amino acid motifs between clones and specimens.
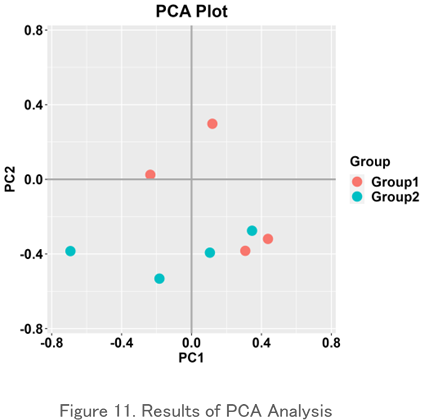
Principal Component Analysis (PCA)
This is one of the methods of multivariate analysis that expresses the similarity between objects in a two-dimensional chart. It shows the relationship between specimens by arranging dots, and similar ones are placed close to each other and different ones are placed far away. It is used to graphically represent the difference or similarity of repertoire between specimens.
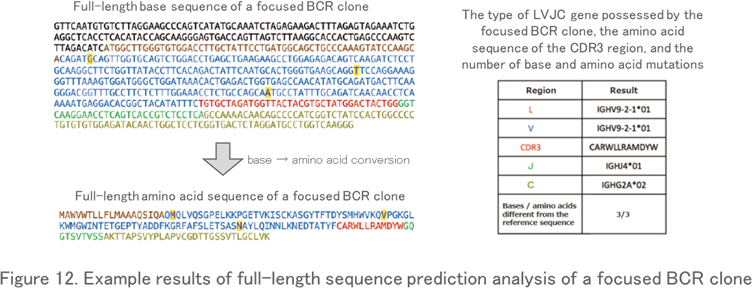
Full-Length Sequence Prediction Analysis
By re-analyzing Fastq data (base sequence data) for a specific read, the full-length sequence from the V region to the C region of the TCR and BCR genes is predicted. This analysis reveals not only the full-length nucleotide and amino acid sequence of the clone, but also nucleotide and amino acid mutations that do not match the reference sequence in the database (Figure 12). For example, it is often used when you want to know the full-length sequence of the BCR clone (or the antibodies) produced by the hybridomas or that of the disease-specific TCR clone.
History of Repertoire Analysis
After the discovery of the mechanism of gene rearrangement of immunoglobulins by Dr. Susumu Tonegawa in 1976, the elucidation of the gene structure and function of the T cell receptor (TCR), which has a similar gene structure with immunoglobulins, has progressed. During that era, important issues of immunology were being revealed by researchers around the world, such as the mechanism by which a variety of receptors are formed that can respond to a myriad of antigens or the mechanism by which receptors differentiate between self and non-self and eliminate non-self.
In the 1980s, genetic engineering techniques, such as cDNA cloning, were widely used, and the sequences of the new V region and J region of TCR gene were revealed. At the time, while Ryuji Suzuki of Shionogi & Co., Ltd. was conducting research on tumor immunity at MD Anderson Cancer Research Center, he considered that it was necessary to find a new tool that could analyze the specificity and diversity of T cells, for research on specific immune responses. Subsequently, he launched a research group focused on TCR repertoire analysis after he returned to Japan.
At that time, the PCR method rapidly spread as a breakthrough technology, and cloning and sequencing of the TCR gene were initiated. In case of the TCR gene, the V region located on the 5′-end of DNA is rich in diversity; hence, special methods such as 5′-RACE, inverse PCR, and anchored PCR have been used. Tsuruta’s study group established a system for analyzing αβTCR and γδTCR (1, 2) by developing an adaptor ligation-PCR (AL-PCR) method that amplifies the TCR gene by adding an adaptor to the 5′-end of the double-stranded DNA of the TCR gene and using the primer set in the adaptor primer and common region (C region). Currently, for a generally used multiplex PCR method that uses several primers specific for the V and J genes, PCR bias occurs due to the difference in amplification efficiency between the primers. By contrast, as AL-PCR can amplify all of the TCR genes in an unbiased manner, it is possible to perform an accurate quantitative analysis. The research group, by utilizing this technology, sought to investigate TCR genes and successfully developed the reverse dot blot (RDB) method using V region-specific oligonucleotide probes together with a chemiluminescence method (3) and microplate hybridization assay (MHA) method (4), which can conveniently quantify samples in a 96-well plate. These quantitative methods, as opposed to the FACS method in the absence of a sufficiently available V chain-specific antibody, were greatly useful for the comprehensive analysis of the TCR repertoire in various fields of basic research and disease-related research.
The specificity and diversity of the TCR largely rely on complementarily-determining region 3 (CDR3). CDR3 is a particularly diverse region that binds directly to antigenic peptides via TCR and to antigens via BCR. Individual TCRs have different lengths of CDR3 sequences because random insertion or deletion of nucleotides occurs between V and D and between D and J for the β chain, and between V and J for the α chain. By utilizing these features, CDR3 size spectra typing analysis has been widely utilized for examining the distribution of lengths of CDR3 sequence via gel electrophoresis. However, it is not possible to determine the CDR3 sequence that is most important for its specificity by using methods such as FACS analysis, quantitative analysis of V gene, and CDR3 length analysis. Therefore, PCR cloning and small sequence analysis have been utilized; and in that situation, next-generation sequencing (NGS) devices have been developed, such as Illumina, Roche454, and Ion Torrent sequencers. At present, we can sequence the TCR gene on a large scale by utilizing NGS and then clarify the sequence information about the specificity and diversity from a large amount of data. Some companies that provide repertoire analysis services using the NGS have been founded, and they mainly use the multiplex PCR method. To overcome the drawbacks of the multiplex PCR method, we (Repertoire Genesis, Inc.) have developed a next-generation TCR/BCR repertoire analysis method that was adopted from the AL-PCR method (unbiased gene amplification technology). We have established a reliable technology that exhibits remarkable excellence in quantification compared to other techniques.
In bioinformatics, Shin-I (one of the founders of our company, and also a president of BITS Co., Ltd.) has developed dedicated repertoire analysis software (Repertoire Genesis) that analyzes the repertoire at a high speed with a high degree of accuracy from large-scale sequence data. Bioinformatics software that can match the obtained individual sequence data to reference sequences at a high speed and can aggregate them was required, as the V, D, and J sequences of the TCR gene consist of a number of similar sequences. By using this software, we can conduct a highly accurate repertoire analysis at a high speed without depending on public databases and programs. We can now conduct a high-resolution and highly expressive repertoire analysis via the intelligible 2D and 3D graphs and the ranking function of clone sequence.
In 2014, by taking advantage of the experience and technology developed in the TCR analysis study and by incorporating the latest NGS technology, we were able to develop a next-generation TCR/BCR repertoire analysis method that integrated unbiased gene amplification technology and original bioinformatics software, for the first time in Japan.
1) Tsuruta Y, et al. J Immunol Methods. 1993, 161(1):7-21.
2) Tsuruta Y et al. J Immunol Methods. 1994, 169(1):17-23.
3) Yoshioka T, et al. J Immunol Methods. 1997, 201(2):145-55.
4) Matsutani T, et al. Hum Immunol. 1997, 56(1-2):57-69.
Usage Example of Repertoire Analysis
Use for Cancer Immunity
For immune checkpoint inhibitors and cancer immunotherapies that utilize the anti-tumor effects of the immune system in the treatment, it is important to detect effector T cells that exert an anti-tumor effect directly. Using methods such as cytotoxic T lymphocyte (CTL) assays and the ELISPOT method, it is not easy to assess tumor infiltrating T lymphocytes (TILs) in cancer tissues directly. Using next-generation TCR repertoire analysis, which assesses qualitative and quantitative changes in TILs, it will be possible to conduct the assessment of the effectiveness of immune checkpoint inhibitors and cancer immunotherapies.
Detection of Leukemia and Malignant Lymphoma
Using next-generation TCR/BCR repertoire analysis, it is possible to measure the clonality of T cells or B cells with high sensitivity, and this method is useful for detecting leukemia or malignant lymphoma. Conventionally, detection of clonal T and B cells has been performed using Southern blotting or PCR. Next-generation TCR/BCR repertoire analysis, in addition to its sensitive detection, has the advantage that tumor cells can be identified on the basis of the nucleotide sequence of the TCR or BCR. Taking advantage of its features, this method is also available for the detection of extremely small residual diseases after treatment. If the TCR or BCR of tumor cells can be identified before treatment, minimal residual disease can be detected with high sensitivity using its nucleotide sequence.
Immune Diversity Recovery After Bone Marrow Transplantation
Next-generation TCR/BCR repertoire analysis is also useful as an indicator to evaluate the diversity of the immune system. In medical transplantations, such as bone marrow transplantation, recovery of immune function after transplantation is a problem. The recovery of the diversity of differentiated T and B cells from stem cells after transplantation is important for the prognosis of infection. Using next-generation TCR/BCR repertoire analysis, it will be possible to evaluate the diversity of T and B cells at the clonal level.
Searching and Tracking of Antigen-specific T Cells
The antigen-specific T cells induced by a specific antigen can be explored. Compared with the control sample or by analyzing samples before and after antigenic stimulation, it is possible to explore T cells (i.e., antigen-specific T cells) altered by antigen stimulation. It is also possible to identify antigen-specific T cells by searching for TCRs, which overlap in multiple individuals stimulated by antigens.
Biomarkers for autoimmune diseases
The causes of many autoimmune diseases have not been fully elucidated, and they are thought to be caused by various abnormalities in the immune system. If we can identify abnormalities in T cells and B cells characteristic of autoimmune diseases by TCR/BCR repertoire analysis, we can use them as biomarkers. In addition, if we can appropriately stratify (subgroup) patients with the same symptoms into those caused by specific T cell abnormalities or those caused by antibody-producing B cell abnormalities, we will be able to develop more effective treatments for these patients.
Infection Immunity
By analyzing samples before and after viral infection, it is possible to identify viral antigen-specific T cells. If we can identify antigen-specific T cells, clone tracking is possible.
Application to Advanced Treatment
The genetic information of TCRs/BCRs obtained using next-generation repertoire analysis techniques can lead to the development of various therapeutics and treatments.
TCR Gene Therapy
From the TCR repertoire analysis of samples stimulated by cancer peptide vaccines and cancer antigens, you can obtain antigen-specific TCRs. By introduction of the TCR gene into patient lymphocytes using existing transgenic technology and returning it to the patient, an effective TCR gene therapy can be developed.
Creation of Antibody Drugs
If we could obtain the full-length sequence of antigen-specific BCRs via next-generation BCR repertoire analysis, we can create a direct human antibody without acquiring and screening hybridoma cells. Somatic hypermutation occurs after the gene rearrangement in BCRs. Therefore, in the multiplex PCR method, it will be difficult to perform accurate quantitative analysis because of mispriming of the primer. It is possible to conduct an accurate analysis of the BCR repertoire using the AL-PCR method, and it is expected that we can acquire antibody genes efficiently.
Chimeric Antigen Receptor-T Cell (CAR-T) Therapy
In recent years, CAR-T therapy, which combines the antigen-binding region of an antibody and a receptor signaling area of TCRs, has been attracting attention. As screening of the cancer antigen-specific antibody genes via next-generation BCR repertoire analysis progresses, it is expected that more effective therapeutic genes will be obtained.